
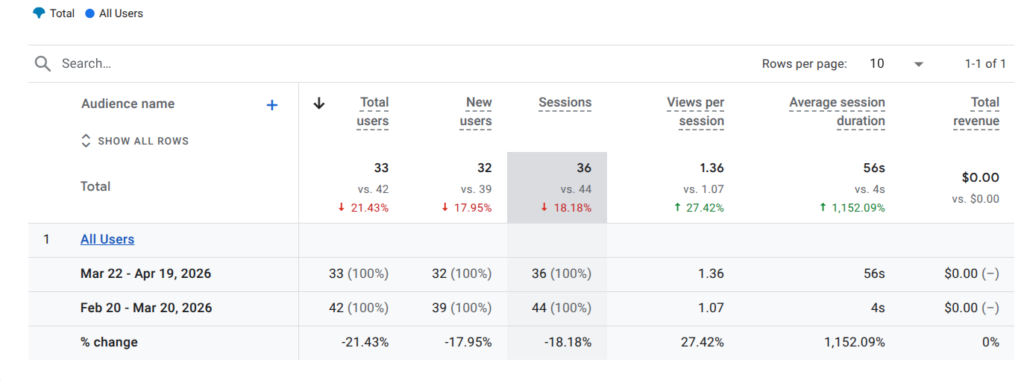
Key metrics introduction (Use acquisition, Page Views & Unique Page Views, Demographic details.)
These metrics are important because that provide insight into many things:
- User acquisition: This reveals how many new users your website is gaining and, just as importantly, where those users are coming from. Knowing which platforms or sources are driving traffic allows you to invest your marketing efforts in the right places.
- Page views & unique page views: This shows which blog posts and pages are resonating most with your visitors. When you know which content performs best, you can replicate that success and create more of what your audience actually wants to read.
- Demographic details: Finally, this allows you to verify that your content is reaching the geographic regions you are trying to target. For Doodle Digital Marketing, understanding which cities and regions are engaging with the blog is critical to ensuring our marketing efforts are landing with the right audience.
In this post, we will walk through each of these three areas, analyze the data using ChatGPT for deeper insights, and identify opportunities to improve performance across the board.
User Acquisition: First User Source/Medium
Why We Use “First User Source/Medium”
We use the First User Source / Medium classification in GA4 because it tells us exactly where a brand-new user first came from before they ever visited our site. Unlike session-based data, this metric is tied to the very first interaction a user has with Doodle Digital Marketing, giving us a true picture of which channels are responsible for growing our audience.
- Why These Metrics Matter
- New Users: This metric counts how many first-time visitors came to the site. It is a direct indicator of how well our outreach and promotional efforts are working to bring in fresh traffic.
- Engagement Rate: Engagement rate shows the percentage of sessions where users actually interacted with the site — scrolling, clicking, or spending meaningful time on a page. A higher engagement rate means our content is connecting with visitors rather than causing them to leave immediately.
- Average Engagement Time: This tells us how long the average user spends actively engaged on the site per session. The longer this number, the more our content is holding people’s attention and delivering value.
GA4 Screenshot – First User Source/Medium
- Describe What Prompts You Use for Each Metric Above
- “Which traffic source has the highest engagement time and what does that suggest?”
- “Compare new users across sources and identify which channel drives the most traffic.”
- “Which source has the highest engaged sessions per active user and what does that indicate about user quality?”

- Result
- The analysis shows that (direct) / (none) generated the highest number of new users, this indicates strong direct traffic
- In contrast, LinkedIn / referral had the highest engagement time indicating extremely high interaction, though likely from a small or specific audience.
- Overall, this suggests that while direct traffic drives volume, LinkedIn and referral sources bring higher-quality users.
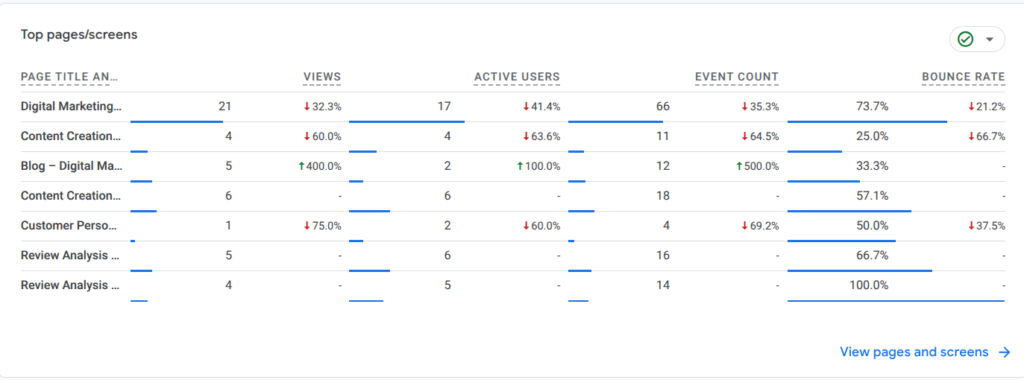
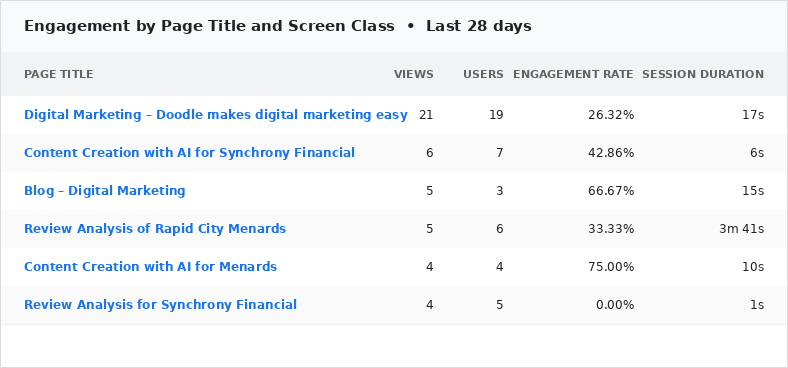
Engagement – Page Title and Screens
I used “Page title and screens” to analyze how users interact with specific pages on the website. This is important because it helps identify which content performs best and which areas may need improvement.
Why these metrics
- Views – shows how often each page is visited
- Users – indicate how many individuals visited each page
- Average Engagement Time per active user – measures how engaging each page truly is
- These metrics help evaluate content performance and user interest
What Prompts You Used for Each metric Above
- Which pages have the highest views and what does that suggest about user interest?”
- “Which pages have the highest engagement time and why?”
- “Identify pages with low engagement and suggest improvements.”
Result
The blog post, specifically the AI Analysis for Menards, received the highest engagement rate, but the home page received the most foot traffic.
All blog post did relatively the same view wise, with “Content Creation with AI for Synchrony Financial,” being the second highest in both users and views, this shows a strong correlation in interest among financial and marketing related content. Similarly, the “Review Analysis of Rapid City Menards,” had the highest session duration among the blog post, but some of these lowest foot traffic.
This suggests that users are most interested in customer persona content, while other pages may need better visibility or more engaging content.
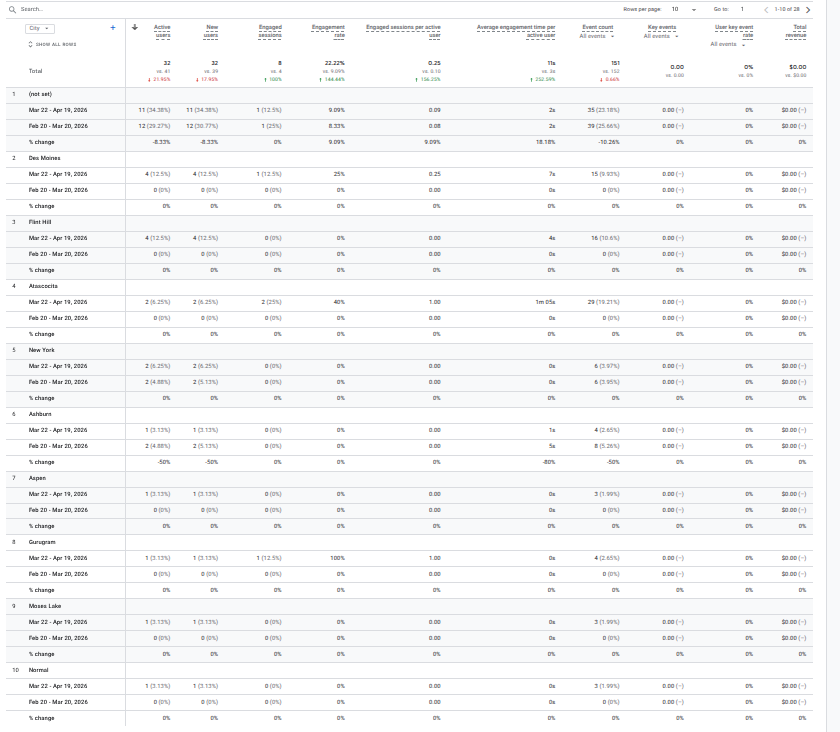
User Attribute – Demographics Details
The Country and City breakdown in GA4’s User Attribute report helps us verify whether the Doodle Digital Marketing blog is reaching the geographic audiences we are targeting. Simply having website visitors is not enough — we need to know if those visitors are coming from the right places. For a digital marketing blog focused on local and regional clients, confirming that users in our target cities are finding and engaging with the site is a key measure of success.
Why I Used These Metrics
- Active users – show audience size by location
- Engagement rate – indicates how many users actively interact
- Average engagement time per active user – measures how long users stay
- Engaged sessions per active user – shows how often users interact
These metrics help evaluate both audience reach and engagement quality
Describe What Prompts You Use for Each Metric Above
- “Which cities have the highest engagement rate and what does that suggest?”
- “Compare engagement time across cities and identify trends.”
- “Which locations bring high traffic but low engagement?”
Result
- The data shows that Des Moines had the highest number of users but very low engagement indicating low-quality traffic.
- In contrast, Flint Hill showed the strongest overall engagement making it the highest-quality audience despite having fewer users.
- Cities like San Jose also showed low engagement, suggesting users are not finding the content as relevant.
Conclusion
This web analysis demonstrates how powerful Google Analytics (GA4) can be when used intentionally to evaluate a website’s performance. By examining user acquisition through the First User Source / Medium report, we were able to identify that the vast majority of Doodle Digital Marketing’s traffic — over 90% — is arriving through direct channels, with small but growing contributions from organic social and search.
The Engagement – Page Title and Screens report revealed that the Review Analysis of Rapid City Menards is by far the most engaging piece of content on the site, with users spending an average of nearly four minutes reading it.
The demographic section highlighted an important lesson: connecting your analytics tools at the very beginning of your website’s life is critical. Because GA4 was not linked during the initial period, city-level data was unavailable for this analysis. Going forward, with tracking fully established, Doodle Digital Marketing will be able to confirm whether content is reaching target markets like Rapid City and Spearfish and measure how deeply those local audiences are engaging.
The combination of GA4’s raw data with AI-powered analysis through ChatGPT proved to be an effective workflow for extracting meaningful, actionable insights. This process collect, organize, prompt, analyze is one any digital marketer can repeat on a monthly basis to continuously refine their content strategy and ensure their website is working as hard as possible for their audience.